
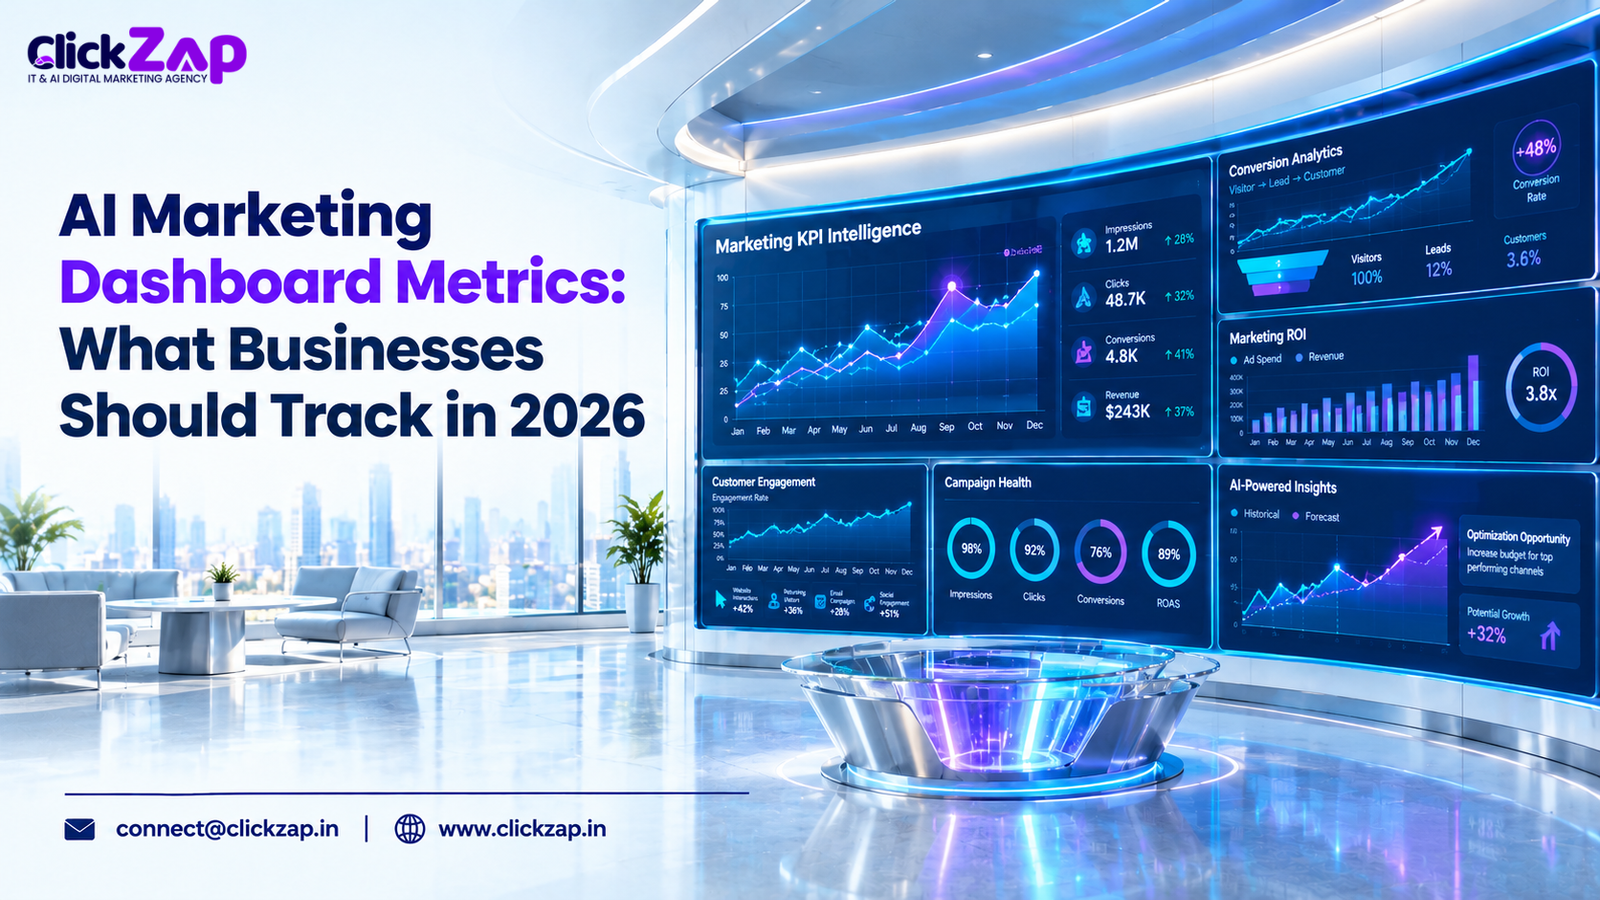
Most marketing teams are not short of data. They are short of clarity, and AI marketing dashboard metrics help by showing which numbers actually deserve action. A typical Monday starts with five browser tabs and three spreadsheets, so the real question is simple: which numbers should we act on first?
AI marketing dashboard metrics help solve that problem. They combine core measurements such as traffic, conversion rate, cost per lead and return on ad spend with AI assisted features that highlight trends, flag unusual changes and summaries what moved. In 2026, that matters because budgets are tighter, channels are more fragmented, and waiting for a month end report is too slow.
In this guide you will learn what these metrics are, why they matter, the 12 you should track, how AI improves reporting, which tools do what, and how to build a dashboard that supports real decisions. Examples are illustrative and use Indian rupees; none are benchmarks or client results.
What Are AI Marketing Dashboard Metrics?
AI marketing dashboard metrics are the performance measurements shown on a marketing dashboard that uses AI assisted features, such as anomaly detection, forecasting and natural language summaries, to help teams interpret results and decide what to do next.
The metrics themselves are not new. Cost per lead is still total spend divided by leads. What changes is how quickly you notice a problem and how well you understand its cause.
Traditional dashboard vs AI enabled dashboard
|
Area |
Traditional dashboard |
AI enabled dashboard |
|
Reporting |
Manual exports, weekly or monthly |
Automated, scheduled, often near real time |
|
Spotting problems |
Someone notices a dip |
Alerts flag unusual changes |
|
Looking ahead |
Past results only |
Forecasts and predicted outcomes (estimates) |
|
Questions |
Build a new report |
Ask in plain language, where the tool supports it |
|
Interpretation |
Analyst writes commentary |
Draft summaries, reviewed by a human |
Four capabilities do most of the work:
- Visualization: charts and scorecards that make patterns visible at a glance.
- Automated reporting: data refreshes and reports go out without manual copy paste.
- Predictive analysis: models estimate where leads, sales or spend are heading.
- Anomaly detection: the system compares today with expected behavior and flags what looks unusual.
Illustrative example: A Hyderabad coaching institute runs Google Ads for admissions. Its dashboard shows cost per lead rising sharply on a Tuesday. An alert surfaces the change the same day rather than in the monthly review. The team checks and finds that a form plugin update broke the submit button, so leads were being lost, not demanded. The metric flagged the symptom. A person found the cause.
Why Should Businesses Track Marketing Dashboard Metrics in 2026?

Because marketing money is only as good as the decisions behind it. Tracking the right numbers helps you:
- Allocate budget with evidence. Move spend toward channels that produce customers, not just clicks.
- Judge campaign performance honestly. Compare campaigns on cost per qualified lead or profit, not impressions.
- Catch issues faster. A broken tracking tag or a disapproved ad can waste days of spend if no one is watching.
- Improve lead quality and conversion. Volume is easy to buy. Leads that become customers are what pay the bills.
- Understand customer experience. Drop offs, bounce patterns and engagement show where visitors get stuck.
- Make confident decisions. Shared definitions end the argument over whose spreadsheet is right.
One practical point: a dashboard does not create value by existing. It creates value when every number on it has an owner and a possible action.
12 Essential AI Marketing Dashboard Metrics Businesses Should Track
These twelve cover reach, conversion, cost, value and diagnosis. You do not need all of them on day one. Pick the ones tied to your goal, then expand.
1. Website Traffic and Traffic Sources
Definition: Sessions (visits), users (individual visitors) and the channels they arrive from: organic search, paid, referral, social, email and direct.
Formula: No single formula. Track sessions and users by channel, plus traffic quality, for example engaged sessions ÷ total sessions (GA4 calls this engagement rate).
Example: Sessions rise 30% after a social push, but the share of engaged sessions falls. You bought volume, not interest.
Act on it: Rank channels by engaged sessions and conversions, not raw visits. Use Google Search Console to see which search queries drive organic clicks.
Where AI helps: Automated insights flag sudden traffic spikes or drops and can help separate real demand from bot like or referral spam traffic.
2. Marketing Conversion Rate
Definition: The share of visitors who complete a goal, such as a form submission, call click or purchase.
Formula: (Conversions ÷ Total Visitors) × 100
Example: 4,000 visitors and 80 enquiries gives a 2% conversion rate.
Act on it: Define “conversion” once and keep it fixed. Then compare by device, source and landing page. A page converting well on desktop and poorly on mobile is a design problem, not a traffic problem.
Where AI helps: It can surface which segments convert unusually well or badly, so you do not have to slice the data by hand.
3. Customer Acquisition Cost (CAC)
Definition: What it costs to win one new paying customer.
Formula: Total Acquisition Costs ÷ Number of New Customers Acquired
What to include: Decide the scope and label it. A “paid CAC” might count only ad spend. A fully loaded CAC also includes agency fees, marketing tools, creative production and the sales salaries or commissions involved in closing. Use one consistent measurement period, and for long sales cycles remember that today’s spend often produces next quarter’s customers.
Example: ₹1,20,000 of total acquisition costs ÷ 8 new customers = ₹15,000 CAC.
Act on it: Always read CAC next to profit per customer. A low CAC on a low margin product can still lose money.
Where AI helps: Predictive scoring can estimate which leads are likely to convert, giving an earlier read on CAC than waiting for deals to close.
4. Customer Lifetime Value (CLV)
Definition: The value a customer is expected to bring over the whole relationship.
Formula (revenue based): Average Order Value × Purchase Frequency × Customer Lifespan
Formula (profit based): Revenue based CLV × Gross Margin, or total gross profit per customer over their lifetime.
Example: Average order ₹2,000, three orders a year, two years: revenue based CLV is ₹12,000. At a 40% gross margin, profit based CLV is ₹4,800.
Act on it: Use profit based CLV when setting CAC limits. Revenue based CLV flatters you. Remember CLV is an estimate, and a young business has little history to base it on.
Where AI helps: Predictive models can estimate future value per customer or segment, which helps decide who deserves more acquisition spend. Treat outputs as estimates.
5. Return on Ad Spend (ROAS)
Definition: Revenue generated for every rupee spent on advertising.
Formula: Revenue Attributed to Advertising ÷ Advertising Spend
Attribution and windows: “Attributed” depends on the platform’s attribution model and conversion window, which is how long after a click or view a sale still counts. Google Ads and Meta Ads Manager each use their own settings, so their reported conversions will not match each other or your bank statement. Reconcile platform ROAS with GA4, your CRM or finance data.
Example: ₹50,000 of ad spend with ₹2,00,000 of attributed revenue is a ROAS of 4.0.
Act on it: Work out your break even ROAS: 1 ÷ gross margin. At a 40% margin it is 2.5. A ROAS of 4.0 is healthy there. At a 20% margin, break even is 5.0, and the same 4.0 loses money.
Where AI helps: Automated bidding and reporting can optimize toward ROAS targets, but they optimize what you tell them to. Feed them clean conversion values.
6. Cost per Lead (CPL)
Definition: The average cost of generating one lead.
Formula: Total Campaign Spend ÷ Number of Leads Generated
Why quality matters: CPL rewards cheap leads, and cheap leads are often poor leads. Always pair CPL with the qualified lead rate.
Example: ₹60,000 ÷ 150 leads = ₹400 CPL. If only 10 are qualified, the cost per qualified lead is ₹6,000.
Act on it: Judge campaigns on cost per qualified lead. Pause the tempting low CPL campaign that produces unreachable numbers.
Where AI helps: It can group leads by source, keyword or audience and show where low CPL hides low quality.
7. Lead Generation Performance
Definition: The full picture of your lead engine: volume, qualified leads, lead to customer conversion and lead quality.
Formula (lead to customer rate): (New Customers ÷ Total Leads) × 100
Example: 200 leads, 60 qualified (30%), 10 customers (5% lead to customer).
Act on it: Close the loop. Record outcomes in your CRM and pass them back to ad platforms, for example through offline conversion imports, so campaigns learn from customers rather than form fills. Also track response time, because slow follow up quietly kills good leads.
Where AI helps: Lead scoring models, available in some CRM and marketing platforms, rank leads by likelihood to convert. Validate the scores against actual outcomes.
8. Customer Engagement Metrics
Definition: Signals that people find your marketing worth their attention: engagement rate, email clicks, meaningful website interactions and social engagement.
Formulas:
- Email click through rate = (Clicks ÷ Delivered Emails) × 100
- Social engagement rate = (Engagements ÷ Reach) × 100 (state whether you use reach or impressions, and stay consistent)
Meaningful interactions: pricing page views, demo video plays, brochure downloads, WhatsApp clicks and form starts.
Example: An email with a 3% click rate and a rising number of pricing page visits is doing more than one with higher opens and no site activity.
Act on it: Lean on clicks and on site actions. Email open rates are unreliable because mail privacy features can inflate them.
Where AI helps: It can flag content, send times or segments where engagement is shifting, and summaries what is working.
9. Marketing ROI
Definition: The profit return on everything you invest in marketing.
Formula: [(Marketing Attributed Profit − Marketing Investment) ÷ Marketing Investment] × 100
ROI vs ROAS: ROAS measures revenue per rupee of ad spend. ROI measures profit against total marketing investment, including fees, tools, creative and team time. ROAS ignores margin and non ad costs. ROI does not.
Example: ₹4,00,000 of revenue on ₹1,00,000 ad spend is a ROAS of 4.0. With a 20% margin, attributed profit is ₹80,000, so ROI = (80,000 − 1,00,000) ÷ 1,00,000 × 100 = −20%. High ROAS, negative ROI.
Act on it: Report both, and say which one you are quoting.
Where AI helps: It can combine spend, revenue and margin data across channels so profit-level views are not built by hand.
10. Marketing Attribution and Customer Journey
Definition: Attribution assigns credit for a conversion to the channels and touchpoints that influenced it. Customer journey analytics shows the path people took.
How models differ: Last click gives all credit to the final touch. First click credits the first. Linear splits credit equally. Time decay favors recent touches. Position based favors first and last. Data driven models use machine learning to distribute credit based on observed paths. Available models vary by platform, and GA4 has narrowed its reporting options over time, so check current documentation.
Example: A buyer finds you through a Search Console visible blog post, clicks a retargeting ad, then converts via a WhatsApp message. Last click credits only the last step.
Act on it: Compare more than one model before cutting a channel. Know the limits too: consent rules, cross device behavior, and calls or WhatsApp chats that web analytics cannot see. Capture the lead source in your CRM.
Where AI helps: Data driven attribution weighs touchpoints statistically. It is still a model, not a fact.
11. Marketing Funnel Performance
Definition: How people move through awareness, consideration, conversion and retention, and where they drop off.
Formula (stage drop off): [(Users at Stage N − Users at Stage N+1) ÷ Users at Stage N] × 100
Example: 1,000 pricing-page visitors, 100 start the enquiry form, 40 submit it. That is a 90% drop before starting and a 60% drop before submitting.
Act on it: Fix the biggest leak first. Add retention measures such as repeat purchase or renewal rate, since a funnel that ends at the sale hides where lifetime value comes from.
Where AI helps: It can highlight segments, devices or sources with unusually steep drop offs.
12. Campaign Anomaly and Predictive Performance Indicators
Definition: Alerts for unusual changes (anomalies) and forecasts of where a metric is heading.
Example: Daily leads fall 40% below the expected range. The alert prompts a check, and the cause turns out to be a tracking fault.
Act on it: Treat every alert as a question: tracking fault, platform issue, or real change in demand? Track forecast accuracy over time, for example by comparing predicted and actual leads.
Where AI helps: Models learn normal patterns, including weekday and seasonal effects, and flag deviations. Some predictive features need minimum data volumes, so smaller sites may not qualify. Predictions are estimates, not guarantees.
How AI Improves Marketing Dashboard Reporting

AI adds value in seven places:
- Automated reporting: scheduled refreshes and reports replace manual exports.
- Real time or near real time monitoring: how fresh depends on each data source’s processing delay.
- Anomaly detection: unusual movements are flagged early.
- Predictive analytics: forecasts of leads, conversions or revenue, shown as estimates.
- Natural language summaries and questions: ask “why did cost per lead rise last week?” where the tool supports it.
- Cross channel analysis: spend and outcomes across search, social and CRM in one view.
- Optimization recommendations: suggested budget, bid or audience changes.
Be clear about the limits. AI insights need human review, reliable data and correct attribution settings. A model fed broken tags or mismatched conversion definitions will produce confident, wrong answers. Our view: the more automated the reporting, the more important it is to audit the inputs.
Best AI Marketing Dashboard Tools for Businesses in 2026
These tools are not direct alternatives. They sit in different layers: advertising platforms generate and report campaign data, analytics platforms measure behavior, marketing suites tie activity to CRM records, visualization tools build dashboards, and AI assistants help analyze. Most businesses combine several.
|
Tool |
Primary Purpose |
Key Metrics or Use Cases |
Best Fit Business Need |
|
Google Analytics 4 (GA4) |
Web and app analytics platform |
Sessions, engaged sessions, conversions, funnels, attribution; built in insights and anomaly detection; predictive metrics where eligible |
Any business needing a core, free behavior and conversion baseline |
|
Google Looker Studio |
Dashboard and reporting visualization |
Combines GA4, Google Ads, Search Console, Sheets and more into shareable reports |
SMBs and agencies building client dashboards |
|
Google Ads |
Advertising platform |
Spend, clicks, conversions, CPL, ROAS, conversion tracking; automated bidding |
Paid search, video and display advertisers |
|
Google Search Console |
Organic search performance tool |
Clicks, impressions, CTR, average position, indexing |
Businesses relying on SEO and content |
|
HubSpot Marketing Analytics |
Marketing and CRM suite reporting |
Source to customer reporting, attribution, lead and funnel reports |
B2B and lead generation teams with an inbound CRM |
|
Salesforce Marketing Cloud |
Enterprise marketing automation and cross channel reporting |
Journeys, email and mobile performance; cross channel reporting in related products |
Larger organizations already on Salesforce |
|
Microsoft Power BI |
Business intelligence and visualization |
Custom dashboards, multi source modelling, forecasting and anomaly visuals |
Teams using Microsoft tools or complex data models |
|
Tableau |
Data visualization and analytics |
Interactive dashboards, exploration, metric monitoring |
Analyst led teams needing deep exploration |
|
Meta Ads Manager |
Advertising platform |
Reach, results, cost per result, ROAS for Facebook and Instagram |
Social first and D2C advertisers |
|
Adobe Analytics |
Enterprise analytics platform |
Segmentation, attribution, anomaly detection; journey analysis via related products |
Large enterprises with complex digital journeys |
|
Google Gemini |
AI assistant and model |
Summarizing exports, drafting insights, explaining trends; reach depends on integration |
Teams adding AI assisted analysis to existing data |
Native AI vs third party integration: Native features live inside a tool, such as GA4’s automated insights or Power BI’s built in visuals. Integrations connect outside AI or data to a tool, such as pulling Meta Ads data into Looker Studio through a partner connector, or using Gemini on exported data. Integrations add setup, cost and data sharing questions.
Verify before relying on any of this: AI features, plan tiers, regions and names change often. Check each vendor’s current documentation.
How to Build an Effective AI Marketing Dashboard

- Define business and marketing objectives. Write them as outcomes, such as “30 qualified enquiries a month at a profitable cost.”
- Select KPIs aligned to them. Choose a handful of KPIs, then supporting diagnostic metrics.
- Connect data sources. Bring in GA4, ad platforms, Search Console and your CRM.
- Standardize metric definitions and attribution settings. Agree what counts as a lead, a customer and a conversion window, and document it.
- Choose a visualization platform. Looker Studio, Power BI or Tableau, depending on skills, budget and data complexity.
- Configure alerts for meaningful changes. Set thresholds that matter, so alerts stay useful.
- Use AI-assisted analysis where appropriate. Start with summaries and anomaly flags before forecasting.
- Review insights and act. Assign an owner and a next step to every finding.
- Monitor and refine regularly. Retire unused metrics, fix broken tracking, and revisit goals quarterly.
Common Marketing Dashboard Mistakes to Avoid
- Tracking too many metrics. Thirty tiles hide the five that matter.
- Chasing vanity metrics. Followers and impressions rarely pay salaries.
- Mixing inconsistent data sources. Different definitions of a lead produce meaningless totals.
- Ignoring attribution limits. No model sees every call, WhatsApp chat or offline visit.
- Treating AI predictions as guarantees. Forecasts are estimates with error.
- Neglecting customer data protection. Check consent, access controls and obligations under India’s Digital Personal Data Protection Act, 2023, and be careful before pasting customer data into any AI tool. Confirm specifics with qualified legal advice.
- Reporting without recommendations. A chart that does not suggest an action is decoration.
How Businesses Can Use AI Marketing Analytics to Improve ROI
Tracking AI marketing dashboard metrics improves ROI only when it changes spending decisions. Five places to look:
- Identify inefficient spend: search terms, placements or audiences that cost money and never convert.
- Improve targeting: find audiences and segments with better lead-to-customer rates.
- Prioritize effective channels: compare channels on cost per customer and profit, not clicks.
- Enhance lead quality: feed CRM outcomes back to campaigns.
- Optimize campaigns: test creative, landing pages and bids against the right metric.
Hypothetical example (illustrative only, not a real result or benchmark): A Hyderabad B2B IT services firm runs two Google Ads campaigns at ₹60,000 each for a month.
|
Campaign A |
Campaign B |
|
|
Leads |
150 |
100 |
|
CPL |
₹400 |
₹600 |
|
Customers won |
6 |
12 |
|
CAC |
₹10,000 |
₹5,000 |
On CPL, Campaign A looks better. On CAC, Campaign B is twice as efficient. The dashboard shows A’s leads rarely progress. The team tests a fix: tighter keywords and a shorter qualification form on A, a controlled budget shift toward B, and a four-week review of cost per qualified lead. If A does not improve, they reduce it. The decision rests on the test, not the first impression.
How to Choose the Right Marketing Dashboard Metrics for Your Business
The right metrics depend on your objectives, sales cycle, available data and measurement capabilities. A starting point:
- Small businesses: calls, enquiries, cost per enquiry, local search visibility and repeat customers. Keep it to five or six numbers.
- E-commerce: conversion rate, ROAS, CAC, average order value, repeat purchase rate and profit based CLV.
- B2B companies: qualified leads, lead to opportunity rate, CAC, sales cycle length and pipeline influence.
- Lead generation businesses: CPL, cost per qualified lead, lead to customer rate and response time.
- Digital marketing agencies: client level ROI and ROAS, CAC, attribution consistency and reporting turnaround, with each client’s goals kept visible.
Best AI Digital Marketing Agency in Hyderabad
If your sales cycle runs several months, lean on leading indicators such as qualified leads and opportunity creation instead of waiting for closed revenue.
Frequently Asked Questions
What are AI marketing dashboard metrics?
AI marketing dashboard metrics are the performance measurements on a marketing dashboard, such as conversion rate, cost per lead, ROAS and CAC, that are supported by AI features like anomaly detection, forecasting and natural language summaries. The metrics themselves are standard; the AI helps teams spot changes faster and interpret results, while humans still verify the data and decide what to do.
Which marketing metrics should businesses track in 2026?
Most businesses should track website traffic quality, conversion rate, cost per lead, customer acquisition cost, return on ad spend, lead quality, customer lifetime value and marketing ROI, plus attribution and funnel drop offs. Start with five to eight tied to one business goal, such as qualified leads or profitable sales, and add others only when you can act on them.
How does AI improve marketing dashboard reporting?
AI improves marketing dashboard reporting by automating routine reports, monitoring data continuously, flagging unusual changes, forecasting likely trends and answering questions in plain language. It saves analysis time and surfaces patterns earlier. It does not replace judgment: outputs depend on accurate tracking, correct attribution settings and human review before any budget decision.
What is the difference between marketing KPIs and dashboard metrics?
A metric is any measurement, such as sessions or email clicks. A KPI (key performance indicator) is a metric chosen because it directly tracks progress toward a specific business objective, such as cost per qualified lead against a monthly target. All KPIs are metrics, but most dashboard metrics are not KPIs. A good dashboard shows a few KPIs supported by diagnostic metrics.
Which tools are best for building an AI marketing dashboard?
There is no single best tool because they do different jobs. GA4 measures website and app behavior, Looker Studio, Power BI or Tableau visualize data, Google Ads and Meta Ads Manager report ad performance, and HubSpot or Salesforce Marketing Cloud connect marketing to CRM data. Many small businesses start with GA4, Search Console and Looker Studio, then add tools as needs grow.
How can businesses use AI marketing analytics to improve ROI?
Businesses improve ROI by using AI analytics to find wasted spend, compare campaigns on cost per qualified lead or profit rather than clicks, move budget to channels that produce customers, and test fixes on underperformers. The gain comes from the decisions made after the insight, not from the AI alone, so changes should be tested and measured.
Conclusion
The best dashboard is not the one with the most charts. It is the one where every number ties to a business objective and leads to a decision. Focus on a small set of AI marketing dashboard metrics, define them consistently, and report profit alongside revenue. Use AI to support human judgment, not replace it, and keep improving your measurement as your business and tools change.
ClickZap IT is a Hyderabad based digital marketing agency that helps businesses strengthen strategy and performance measurement. If you want a clearer view of what your marketing is really delivering, contact the ClickZap IT team to discuss your goals.
Also Read: How to Use AI Marketing Anomaly Detection to Improve Campaign Performance

0 Comments