
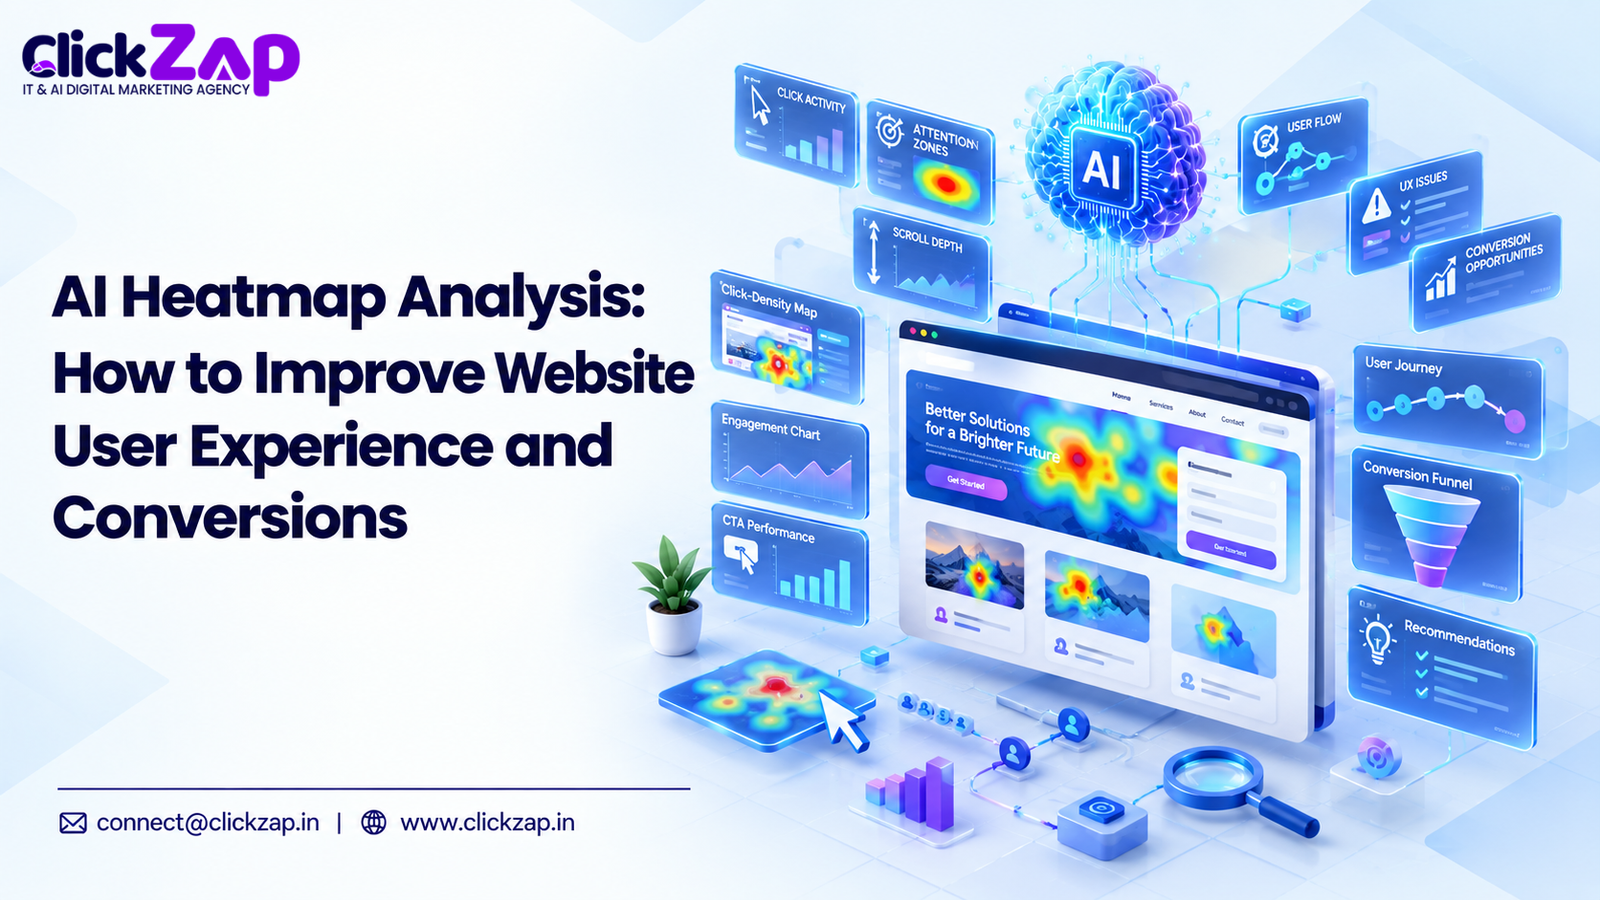
Most businesses judge their website by traffic numbers. Sessions are up, so things must be working, right? Not necessarily. Traffic tells you how many people showed up. It says nothing about what they actually did once they got there, and that is exactly what AI heatmap analysis is built to reveal.
Visitors click the wrong elements. They ignore CTAs that seem obvious to you. They stop scrolling before reaching your pricing table. They struggle to find your contact form and leave instead of filling it out. None of this shows up in a standard analytics dashboard but it shows up in a heatmap.
AI heatmap analysis takes this a step further. Instead of just showing you where people clicked, scrolled, or moved their cursor, it uses artificial intelligence to interpret that data spotting patterns, flagging friction points, and surfacing insights that would take a human analyst hours to find manually.
This guide breaks down what AI heatmap analysis actually is, how it works, which tools support it, and how to use it to fix real UX problems and improve conversions.
What Is AI Heatmap Analysis?
AI heatmap analysis is the use of artificial intelligence to interpret visual and behavioral data clicks, scrolling, mouse movement, and attention collected from website visitors. Instead of only visualizing where activity happens, AI models detect patterns automatically, flag unusual behavior like rage clicks, and generate insights that help teams prioritize UX and conversion fixes without manually reviewing every recording.
A website heatmap is a visual representation of visitor activity overlaid on your page usually shown as a color gradient, with “hot” (red/orange) areas marking high activity and “cool” (blue) areas marking low activity. Traditional heatmaps have been around for years, built into tools that record clicks, scrolls, and cursor movement.
What AI adds is interpretation at scale. A traditional heatmap shows you what happened. AI website heatmap analysis tries to tell you why it matters by automatically detecting patterns across thousands of sessions, grouping similar behaviors, flagging anomalies, and translating raw interaction data into insights a non technical team member can act on.
This matters because a single heatmap on a single page is manageable to read manually. A hundred heatmaps across an entire site, across devices, across visitor segments, is not. That’s the practical reason AI powered heatmap analysis has become useful rather than optional for anyone doing serious UX or conversion rate optimization work.
How Does AI Heatmap Analysis Work?
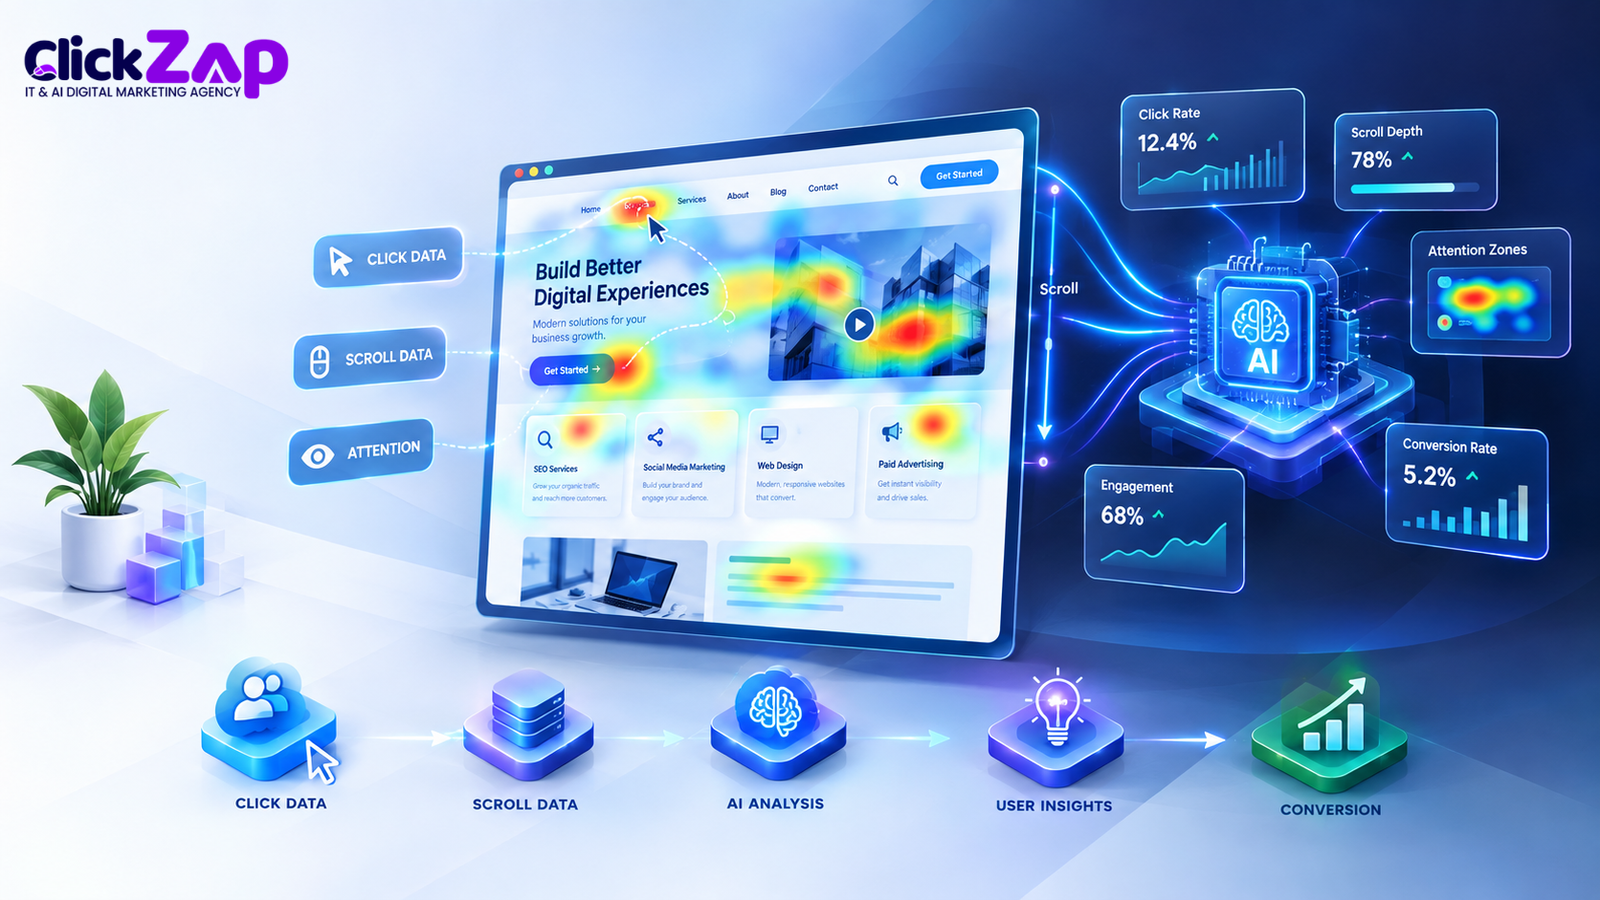
The process behind AI heatmap tools generally follows these steps:
- Collect visitor interaction data tracking scripts record clicks, taps, scrolling, and mouse movement across sessions.
- Track clicks and interactions every click, tap, and hover is logged against its exact position on the page.
- Analyze scroll behavior the tool records how far down each page visitors actually scroll.
- Identify attention patterns based on cursor movement and dwell time, tools estimate where visitor attention is concentrated.
- Detects unusual or repeated behavior AI models flag things like rage clicks or dead clicks.
- Identify website friction points the system highlights where visitors hesitate, backtrack, or drop off.
- Generate actionable insights instead of a raw visual map, the platform produces a written summary or prioritized list of issues.
- Apply UX or CRO improvements teams use these insights to redesign layouts, CTAs, or navigation.
- Measure the results and changes are tracked against engagement and conversion metrics to confirm impact.
The AI layer mainly sits in steps 5 through 7 pattern detection, anomaly flagging, and summarization which is where AI heatmap analysis differs most from older, purely visual heatmap tools.
Types of Heatmaps AI Can Analyze
Click Heatmaps
Click heatmaps show exactly where visitors click or tap, revealing whether they’re engaging with your intended CTAs or clicking on non clickable elements, a strong signal of a confusing layout.
Scroll Heatmaps
Scroll heatmaps show how far down a page the average visitor scrolls. If most visitors never reach your pricing section or testimonials, that content is effectively invisible, no matter how well it’s written.
Attention Heatmaps
Attention heatmaps (also called engagement or move heatmaps) estimate which areas of a page receive the most visual focus, based on cursor position and dwell time. These help identify whether visitors are actually noticing your headline, offer, or key value proposition.
Movement Heatmaps
Movement heatmaps track cursor paths across the page. While cursor movement isn’t a perfect proxy for eye movement, it can still reveal hesitation, backtracking, or erratic navigation patterns.
Segmented Heatmaps
Segmented heatmaps let you compare behavior across different visitor groups desktop vs. mobile, new vs. returning visitors, or traffic from different campaigns. AI heatmap for UX work becomes far more useful once you can segment, because behavior on a landing page from a paid ad often looks nothing like behavior from organic search traffic.
AI Heatmaps vs Traditional Heatmaps
|
Factor |
Traditional Heatmaps |
AI Heatmaps |
|
Data analysis |
Manual, page by page review |
Automated pattern detection across many pages/sessions |
|
Pattern detection |
Relies on the analyst noticing trends |
AI surfaces recurring patterns automatically |
|
Automation |
Limited |
High summaries and alerts generated automatically |
|
Behavioral insights |
Visual only |
Visual + interpreted insights |
|
Segmentation |
Often manual and time consuming |
Faster, sometimes automated segment comparison |
|
Scalability |
Difficult across large sites |
Built to handle large data volumes |
|
Anomaly detection |
Analyst has to spot rage/dead clicks manually |
AI flags these behaviors automatically |
|
Optimization recommendations |
Rarely included |
Often included as suggested next steps |
|
Human interpretation required |
High |
Still required AI assists, doesn’t replace judgment |
It’s worth being clear about that last row: AI can surface patterns faster than a human scanning recordings one by one, but it doesn’t understand your business goals, brand positioning, or industry context. A UX or marketing professional still has to decide what a pattern actually means and whether acting on it makes sense.
Why AI Heatmap Analysis Matters for Website UX
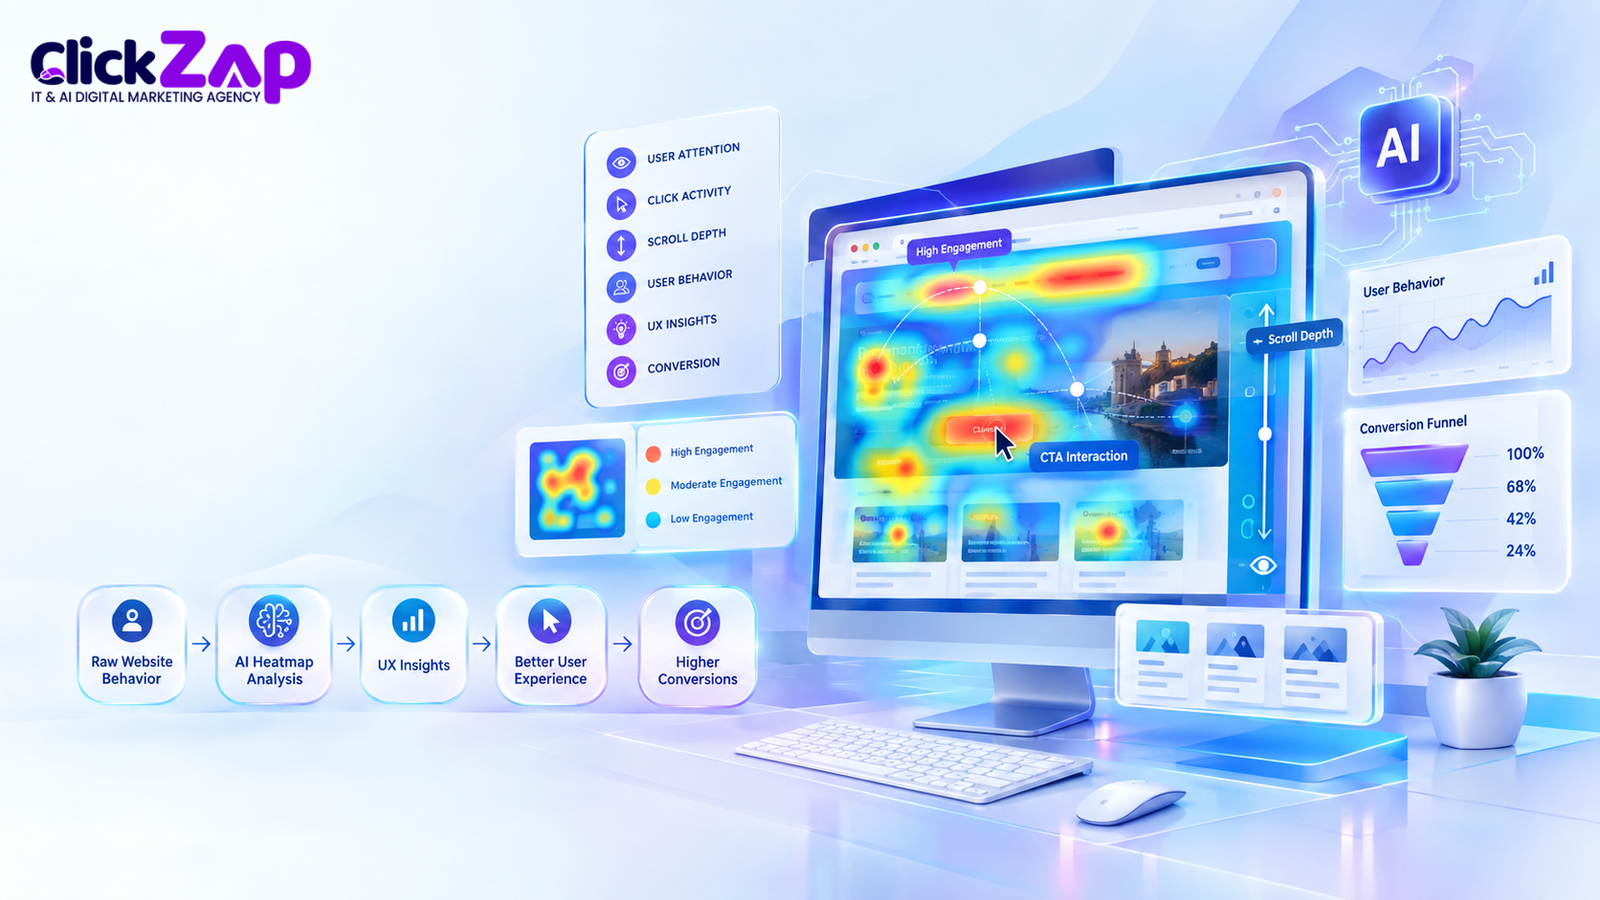
Website user experience is shaped by dozens of small decisions where a CTA sits, how a form is structured, whether navigation is intuitive. AI heatmap analysis gives you evidence for those decisions instead of guesswork.
It directly informs:
- Website navigation: are visitors finding menu items, or hunting for them?
- Page layout is content ordered the way visitors actually consume it?
- Content placement is your most important message above the fold, or buried?
- CTA visibility are calls to action getting noticed, or ignored?
- Mobile UX does the experience hold up on a small screen?
- Form usability where do visitors hesitate or abandon a form?
- Website engagement: how long and how deeply do visitors interact with a page?
- Landing page experience: does the page match visitor intent from the ad or search query that brought them there?
- User journey does one page logically lead to the next?
Every one of these directly affects visitor behavior, and visitor behavior is what ultimately determines whether your website converts.
How AI Heatmap Analysis Improves Conversion Rates
Conversion rate optimization is fundamentally about removing friction between a visitor’s intent and the action you want them to take. AI heatmap conversion optimization works by identifying exactly where that friction happens.
Practical examples include:
- Improving CTA placement if a heatmap shows most visitors never scroll past the hero section, your primary CTA probably needs to live there, not further down.
- Reducing distractions if attention heatmaps show visitors focusing on decorative images instead of your offer, simplifying the layout can redirect focus.
- Simplifying forms if scroll or click data shows drop off at a specific form field, that field is likely the problem.
- Improving landing page structure reordering sections based on where attention naturally concentrates.
- Moving important information higher if scroll depth data shows 70% of visitors never reach a key section, it needs to move up.
- Improving navigation dead clicks on menu items often reveal confusing labeling.
- Removing confusing elements non clickable elements that get clicked repeatedly usually need to become clickable, or be redesigned so they don’t look interactive.
- Optimizing mobile experiences mobile heatmaps often reveal buttons that are too small or too close together.
None of this guarantees a specific conversion lift results depend on your industry, traffic quality, and execution. But fixing evidence based friction points is a far more reliable strategy than redesigning a page based on opinion alone.
What User Behavior Can AI Heatmaps Reveal?
AI heatmap tools surface several categories of behavior:
- Click behavior what visitors actually interact with
- Scroll depth how far visitors get before leaving
- Engagement patterns which sections hold attention longest
- Repeated clicks / rage clicks frustration signals, often pointing to broken or unresponsive elements
- Dead clicks clicks on elements that don’t respond, indicating a design that looks clickable but isn’t
- Navigation problems confusion moving between pages or sections
- Abandonment points exactly where visitors leave a page or funnel
- Website friction points any spot where behavior suggests hesitation or difficulty
- Content engagement which content sections actually get read or viewed
- CTA interaction whether calls to action are noticed and clicked
Each of these matters because it points to a specific, fixable problem rather than a vague sense that “conversions could be better.”
How to Use AI Heatmap Analysis for Website Optimization

Step 1: Define the business goal. Be specific to increase leads, increase purchases, improve engagement, reduce cart abandonment, or improve landing page performance. Heatmap data without a goal is just noise.
Step 2: Select important website pages. Prioritize homepage, landing pages, product or service pages, pricing pages, checkout pages, contact pages, and lead generation pages the pages where conversions actually happen.
Step 3: Collect behavioral data. Run heatmap and session recording tools alongside your existing analytics platform for a meaningful sample period.
Step 4: Analyze visitor behavior. Look for consistent patterns across sessions, not a single unusual recording.
Step 5: Identify friction points. Prioritize issues by how many visitors they affect and how close they sit to conversion.
Step 6: Make controlled changes. Change one or two elements at a time. Changing everything at once makes it impossible to know what actually worked.
Step 7: Measure the results. Track the relevant metric form completions, add to cart rate, scroll depth, bounce rate against your baseline.
Step 8: Repeat the process. UX optimization isn’t a one time project. Visitor behavior, devices, and traffic sources change over time, so heatmap analysis for UX should be an ongoing habit, not a single audit.
Best AI Heatmap Tools for Websites
Several platforms offer AI powered heatmap and behavioral analysis capabilities. Feature sets change frequently, so always confirm current functionality directly with the vendor before making a decision.
- Microsoft Clarity : a free heatmap and session recording tool with built in AI generated insights and rage/dead click detection.
- Hotjar : combines heatmaps, session recordings, and AI assisted highlights to summarize key behavioral trends.
- Crazy Egg : offers click, scroll, and confetti heatmaps with reporting features aimed at marketers.
- Mouseflow : provides heatmaps, session replay, and friction scoring to flag problematic pages.
- FullStory : behavioral analytics platform with AI assisted search and session analysis for product and UX teams.
- Contentsquare : an enterprise grade digital experience analytics platform with AI driven UX and journey insights.
- Smartlook : combines heatmaps and session recordings with event tracking for web and mobile apps.
- Lucky Orange : heatmaps, recordings, and conversion funnels aimed at small to mid sized ecommerce sites.
- Attention Insight : uses AI to predict attention patterns on a design before it goes live, without needing live traffic.
The right tool depends on your site’s traffic volume, budget, and whether you need enterprise level segmentation or a simpler small business setup.
How AI Heatmaps Work With Google Analytics 4
Google Analytics 4 and heatmap tools answer different questions, and using them together gives a much fuller picture of visitor behavior. GA4 tells you what happened at an aggregate level traffic sources, engagement metrics, conversion events, and funnel drop off. Heatmaps show you how visitors interacted with a specific page visually.
For example, GA4 might show that a landing page has a high bounce rate. A heatmap can show you why visitors aren’t scrolling past the hero section, or they’re clicking on an element that doesn’t lead anywhere. Used together, GA4 and AI heatmap analysis turn a quantitative problem into a specific, visual, fixable one.
How Google Tag Manager Supports Heatmap Tracking
Google Tag Manager makes it easier to deploy and manage tracking scripts including heatmap and behavioral analytics tags without editing your website’s code directly every time. It lets marketing teams add, update, or remove tracking tags, set up custom event triggers, and manage multiple analytics tools from a single interface.
For heatmap tracking specifically, GTM is commonly used to control which pages load tracking scripts and to fire custom events tied to specific interactions. As with any tracking setup, avoid configuring tags to capture personally identifiable information such as names, emails, or payment details within heatmap or session recording tools.
AI Heatmap Analysis for Landing Page Optimization
Landing pages carry a disproportionate amount of a website’s conversion responsibility, which makes them a priority for AI heatmap for website analysis. Key elements worth examining include:
- Hero section and headline clarity
- CTA visibility and placement
- Form length and field friction
- Trust signals (reviews, logos, certifications)
- Product or service information clarity
- Pricing section visibility
- Testimonials placement
- Navigation and footer content
Example: A scroll heatmap might show that only 30% of visitors reach a landing page’s testimonials section, while a click heatmap shows dead clicks on a CTA button that isn’t actually linked properly. Fixing the broken link and moving trust signals higher on the page are both evidence based decisions instead of guesses.
AI Heatmap Analysis for E-commerce Websites
E-commerce sites benefit heavily from AI website heatmap analysis because small friction points at scale translate directly into lost revenue. Common areas to examine:
- Product image interaction (zoom, gallery clicks)
- Add to cart button engagement
- Product description read depth
- Filter and search usage
- Checkout flow friction
- Promotional banner engagement
- Mobile shopping behavior specifically
If heatmaps show visitors repeatedly clicking a product image expecting it to zoom, or abandoning checkout at a specific field, those are concrete, prioritized fixes not abstract UX theory.
AI Heatmap Analysis for Mobile Websites
Mobile behavior deserves its own analysis, not just a smaller version of the desktop review. Mobile visitors interact differently tapping instead of clicking, scrolling more due to limited screen space, and often browsing in shorter, more distracted sessions.
Mobile specific issues that heatmaps often reveal:
- Buttons too small or too close together for reliable tapping
- Navigation menus that are harder to use on touchscreens
- Excessive scroll depth required to reach key content
- Forms that are difficult to complete on mobile keyboards
- CTAs that get pushed below the fold on smaller screens
- Content hierarchy that doesn’t adapt well to a vertical layout
Given how much traffic now comes from mobile devices, segmenting heatmap data by device type isn’t optional; it’s a baseline requirement for accurate UX optimization.
AI Heatmap Analysis and Customer Journey Analysis
Heatmaps give you page-level detail, but conversions usually happen across multiple steps:
Landing Page → Product/Service Page → CTA → Form/Checkout → Conversion
Customer journey analysis looks at behavior across this entire path, while heatmaps zoom in on how visitors behave within each individual page. Combining both gives you a complete view: journey analysis tells you where visitors drop out of the funnel, and heatmaps tell you what’s happening on the specific page where that drop off occurs.
Common Problems AI Heatmaps Can Help Identify
- CTA blindness : visitors simply don’t notice or register calls to action
- Poor content hierarchy : important information is buried below less relevant content
- Confusing navigation : visitors struggle to find what they’re looking for
- Dead clicks : clicks on elements that aren’t actually interactive
- Rage clicks : repeated frustrated clicking, usually on broken or slow elements
- Excessive scrolling : key content requires too much effort to reach
- Unused content : sections nobody engages with, wasting valuable page space
- Form abandonment : specific fields or steps causing drop off
- Mobile usability problems : elements that don’t translate well to smaller screens
- Distracting elements : design choices pulling attention away from the goal
- Poorly positioned trust signals : reviews or certifications placed where they don’t get seen
How AI Heatmap Optimization Supports SEO
It’s important to be precise here: heatmaps are not a direct Google ranking factor. AI heatmap optimization doesn’t influence SEO directly but the UX improvements it drives can indirectly support search performance.
Better UX can improve engagement signals, reduce bounce rates, and make content more accessible and usable all of which contribute to a stronger overall website experience. That’s a separate outcome from technical SEO, keyword targeting, or backlink building, but it complements them. Pairing heatmap driven UX fixes with Google Search Console data gives a fuller picture of both how visitors find your site and what they do once they arrive.
How AI Can Improve Heatmap Analysis
AI brings several specific capabilities to heatmap analysis:
- Pattern recognition : spotting recurring behavior across large volumes of sessions
- Behavioral segmentation : grouping visitors by device, source, or behavior type automatically
- Anomaly detection : flagging rage clicks, dead clicks, or unusual navigation paths
- Automated summaries : turning raw heatmap data into plain language insights
- Large scale data analysis : processing far more sessions than a human could review manually
- Predictive insights : in some tools, estimating likely attention patterns before a page even goes live
- Prioritization of UX issues : ranking friction points by potential impact
Tools like ChatGPT can be useful for summarizing exported heatmap data or drafting hypotheses about visitor behavior, but it’s worth being clear: ChatGPT doesn’t have automatic access to your website’s private visitor data. Any AI assisted analysis requires a proper data export or integration first.
AI Heatmap Analysis + Microsoft Power BI
Combining behavioral data with business intelligence tools like Microsoft Power BI allows teams to build broader dashboards that connect heatmap insights with other business metrics. Practical use cases include:
- Marketing dashboards combining traffic, engagement, and heatmap derived UX scores
- Conversion reporting that ties behavioral insights to actual revenue or lead data
- UX performance reporting across multiple pages or time periods
- Customer behavior trend tracking over longer periods
- Campaign level analysis comparing landing page behavior across different traffic sources
This kind of integration typically requires exporting heatmap data and connecting it to Power BI through supported data connectors capabilities vary by platform, so confirm what your specific heatmap tool supports before planning a dashboard build.
Best AI Digital Marketing Agency in Hyderabad
Common AI Heatmap Analysis Mistakes
- Looking at heatmaps without a clear goal in mind
- Treating every click as equally important
- Ignoring mobile users entirely
- Ignoring where traffic is coming from
- Making decisions based on a very small sample of sessions
- Changing too many page elements at once
- Confusing correlation with causation
- Ignoring qualitative feedback like surveys or support tickets
- Focusing only on clicks while ignoring scroll and attention data
- Not measuring results after making a change
AI Heatmap Analysis Best Practices
- Start with a clear business objective before opening any heatmap
- Analyze high value pages first homepage, landing pages, checkout
- Segment visitors by device, source, and behavior
- Compare desktop and mobile behavior separately
- Look for repeated patterns across many sessions, not one off cases
- Combine heatmap data with GA4 or other analytics platforms
- Use session recordings alongside heatmaps for added context
- Prioritize high impact friction points over minor cosmetic issues
- Test changes before rolling them out sitewide
- Continuously monitor results rather than treating optimization as a one time task
Frequently Asked Questions About AI Heatmap Analysis
What is AI heatmap analysis?
AI heatmap analysis uses artificial intelligence to interpret visitor behavior data clicks, scrolling, and attention collected through heatmap tools. Instead of only visualizing activity, AI detects patterns, flags anomalies like rage clicks, and generates actionable insights that help teams identify and prioritize UX problems faster.
How does an AI heatmap work?
It works by collecting interaction data through tracking scripts, then applying AI models to detect patterns across sessions such as where visitors click, how far they scroll, and where they hesitate. The AI layer summarizes this data into insights instead of requiring manual review of every recording.
What is the difference between AI heatmaps and traditional heatmaps?
Traditional heatmaps display raw visual data that analysts must review manually. AI heatmaps add automated pattern detection, anomaly flagging, and generated insights, making it faster to analyze large volumes of behavioral data across many pages and visitor segments.
What are the best AI heatmap tools?
Popular AI powered heatmap tools include Microsoft Clarity, Hotjar, Crazy Egg, Mouse flow, Full Story, Contents quare, Smart look, Lucky Orange, and Attention Insight. The right choice depends on your traffic volume, budget, and whether you need enterprise level segmentation.
Can AI heatmaps improve website conversions?
AI heatmaps can improve conversions by identifying specific friction points confusing CTAs, form drop off, or ignored content that are fixable once identified. Results depend on execution and traffic quality; heatmaps inform decisions, they don’t guarantee a specific conversion increase on their own.
Conclusion
Traffic numbers tell you people are arriving. AI heatmap analysis tells you what happens after they click, where they click, where they stop, and where they leave. That difference is the entire foundation of meaningful UX and conversion rate optimization work.
The businesses that get the most out of AI heatmap tools aren’t the ones running the fanciest software, they’re the ones asking a clear question first, checking the data, making one controlled change at a time, and measuring what actually moved. If your team needs help turning heatmap data into an actual optimization plan, our digital marketing agency can help you connect behavioral insights to real UX and conversion improvements get in touch with our team to talk through what that would look like for your site.
Also Read: AI Landing Page CRO: How AI Improves Conversions and Landing Page Performance


0 Comments